Saturday, December 29, 2012

Western Cities Lead the Pack In Home Price Recovery


If you’re looking for the source of this year’s home price recovery, look West.

Western cities are recovering strongly after being hit hardest during the real estate bust. The trend was confirmed Tuesday with the release of the Standard & Poor's/Case-Shiller index of 20 large cities. The index was down 0.1% in October from September but up 4.3% compared with October 2011.

San Francisco and Phoenix have both rebounded from their most recent lows. The two cities are up 22.5% and 22.1%, respectively. The improvement in those two cities illustrates distinct real estate trends on the West Coast.

The San Francisco example shows how coastal markets in California are rising sharply even as inland areas lag behind. The San Francisco metro area is one of the most desirable housing markets in the nation.

The Bay Area’s economy, and the housing market there, have also been boosted by the strength of the technology industry.

Phoenix, on the other hand, has recovered sharply as investors have poured into that market looking for homes to buy on the cheap, renovate and then either rent out or sell.

Investors in the Phoenix area made about 37.2% of all home purchases last month, according to research firm DataQuick, that number has declined as buyers intending to find a place to live have been lured back to the market. The peak for absentee-buyer purchases in the Phoenix area was March of last year, with investors snapping up 47.1% of all homes that month.

According to the Case-Shiller data released Wednesday, prices in the Los Angeles metro area are up 10.5% from their bottom and up 12.2% in San Diego.

In terms of month-over-month gains, Las Vegas posted the strongest increase up 2.8% in October over September. That city also hit an important benchmark in October, rising above its January 2000 index level for the first time in 22 months.

Of all the cities, Chicago was the weakest with prices dropping 1.5% month over month, while Boston was a close second, falling 1.4%.

Friday, December 21, 2012

Bay Area Median Home Price Hits $550,000


Citing increased demand, strained inventory, record-low mortgage rates and robust investor interest, a real estate information service reported this month that Santa Clara County continued its rise in this fall.

DataQuick reported that the median home price in Santa Clara County rose to $550,000 in November, up 21.7 percent from $452,000 a year earlier. A total of 1,478 homes were sold in November, up 15.5 percent from 1,707 in November 2011.

The rise of the median home price in Santa Clara County had some individual cities showing remarkable spikes, according to DataQuick's city data for October. In Palo Alto, for instance, the median home price jumped from $1,058,000 in October 2011 to $1,605,000 in October 2012, a more than 51 percent increase.

Los Gatos, Gilroy, Milpitas, Saratoga and Mountain View all had double-digit, year-over-year percentage increases in their median home price.

The month of strong sales and rising sale prices in Santa Clara County was on part with most of the Bay Area housing market, which "continued its march toward normalcy in November," DataQuick reported.

A total of 7,296 new and resale homes were sold in the nine-county Bay Area last month. That was up 15.5 percent from 6,317 for November 2011, according to DataQuick.

“Current trends are likely to stay with us well into spring, at least,” John Walsh, DataQuick president, said in a statement. "One of the variables that could really impact the market would be supply—how many homes are put up for sale. There are still mortgage finance issues. Some loan categories are not active. But right now, low mortgage interest rates make up for that."

The median price paid for a home in the Bay Area was $438,000 in November. That was up 5.3 percent from $416,000 in October and up 20.5 percent from $363,500 in November a year ago. Last month’s median was the highest since August 2008, when it was $447,000.

Here's a Bay Area breakdown of home sales and median price: 

All Homes #Sold  #Sold  % Change Median Median % Change
Nov. 2011 Nov. 2012 Nov. 2011 Nov. 2012
Marin 239       272 13.8% $629,000 $682,000   8.4%
Alameda 1,334 1,525 23.7% $340,000 $415,000 22.1%
Contra Costa 1,225 1,394 13.8% $255,000 $322,000 26.3%
Napa  99 133 34.3%  $297,000 $360,000  21.2%
Santa Clara  1,478 1,707 15.5% $452,000 $550,000 13%
San Francisco 422 524 24.2% $644,500 $728,000 25.1%
San Mateo 513 612 19.3% $542,500 $618,000 13.9%
Solano 522 584 11.9% $190,000 $221,500 16.6%
Sonoma  485         545 12.4% $285,000 $349,000 22.5%
Bay Area 6,317 7,296 15.5% $363,500 $438,000  20.5%
 
Last month distressed property sales—the combination of foreclosure resales and “short sales”—made up 35.0 percent of the resale market. Foreclosure resales—homes that had been foreclosed on in the prior 12 months—accounted for 11.5 percent of resales in November.

Absentee buyers, mostly investors, purchased 24.4 percent of all Bay Area homes in November, up from 23.7 percent in October, and up from 21.7 percent a year ago.

Here's a breakdown of Los Gatos home sales and median price:

Palo Alto
Zip Code
Homes
sold Oct. 
2012
% Change
from Oct. 2011
Median Price
Oct.
2012

94301 15 168.3% $2,415,000
94303 36 205.3% $870,000
94306 26 41.2% $1,624,000

Sunday, December 16, 2012

Home Prices Predicted to Rise Through 2013


U.S. home prices will likely continue rising in 2013, according to the latest round of predictions from Freddie Mac. The government-controlled mortgage giant expects the U.S. house price index to rise by 2% to 3% in 2013.

On December 11, 2012, Freddie Mac published the latest installment of their U.S. Economic and Housing Market Outlook. The monthly report compiles economic data from a variety of sources and makes forecasts based on that information. According to the latest report, all major house price indexes (HPIs) are now showing year-over-year price gains. They cited 4.5% appreciation reported by the Federal Housing Finance Agency as one example.

But it was their housing market predictions for 2013 that made headlines. The economists at Freddie Mac expect U.S. home prices to climb by up to 3% next year.

Price Trends Vary Widely at Local Level

It should be noted, this was a national prediction that averages home prices across the country. We have seen a significant amount of price variation at the local level in recent years, and this will likely continue through 2013. Some cities (like many in California) will appreciate steadily over the coming months. In fact, some may see double-digit gains in home prices. Others will remain stagnant or experience only modest gains.

Inventory was a key factor for the cities that fared well in 2012. For instance, the number of homes for sale in Sacramento, California dropped by 60% over the last year or so. That was the largest reduction of any of the 146 metro areas tracked by Realtor.com. As a result, the median list price in Sacramento shot up by 31% over the last year (another national record).

But here again, there is much variation in local housing markets. While the median list price was skyrocketing in Sacramento, it was plummeting in Peoria, Illinois. This is why it’s so hard to define ‘the’ housing market in national terms.

Since the housing crisis began, we have seen increased regionalization of home prices. Local housing markets move to the pulse of their own economies, with less influence from national trends. As an example, home prices in Phoenix rose by 20% over the last year or so, while dropping by -2.3% in New York City. Different markets, different pricing trends.

How to Research Home Values in Your Area

Home buyers should research housing conditions at the local level, before plunging into the market. National news is interesting, but it’s not very useful for someone concerned with home prices in, say, Boise or Tallahassee. So where does one turn for local market information? Here are some tips.

If you happen to live in or near one of the cities tracked by the S&P/Case-Shiller Home Price Index, you’ll find it useful. The Case-Shiller 20-city composite monitors home values in the following metropolitan cities: Atlanta, Boston, Charlotte, Chicago, Cleveland, Dallas, Denver, Detroit, Las Vegas, Los Angeles, Miami, Minneapolis, New York, Phoenix, Portland, San Diego, San Francisco, Seattle, Tampa, and Washington, D.C. It shows month-to-month changes in home prices, with a two-month lag time.

But what if you don’t live in one of those 20 cities? There are other ways to research local real estate trends.

The National Association of Realtors (NAR) publishes median home price information for 149 metropolitan areas in the U.S. It takes the form of an interactive Google map with clickable icons. Just Google “NAR median area prices” to find it, or use the URL below.


The full URL for the map:
http://www.realtor.org/topics/metropolitan-median-area-prices-and-affordability/data

http://www.santacruzlocalrealestate.com


Monday, December 10, 2012

The California Real Estate Landscape for 2013


Up-trending home prices are seen as a great sign by most people involved in real estate, because they instill a sense of comfort that, financially speaking, the market can return to the glory days prior to its collapse. But the sad truth is, there are more factors than home prices that affect real estate’s health, no matter how encouraging the rise may be.

 Still, the trend doesn’t keep sellers and property owners from wishfully believing that they’ve regained some form of control as if the balance has shifted back toward their favor.
Unfortunately for them, the main reason for price increases has nothing to do with buyers eagerly purchasing new properties; rather, it hinges upon a more balanced proportion of supply and demand as fewer houses were built this year. Although predictions for 2013 include an increase in overall supply, the amount of new houses estimated for the upcoming year will still be way under the 2.5 million output of 2005.

This slow growth is good for the market’s recovery long-term, though. As more Americans secure employment – and those who are employed see increases in income – the time will soon be rife for increased home buying. Until then, those potential buyers are doing exactly what they should: establishing a firm financial foundation that will facilitate a home purchase. And that’s exactly what the market needs: serious buyers who have the financial means to avoid upside down mortgages.

Is real estate back in the hands of sellers? Absolutely not, but markets will see trends that seem to reflect otherwise. As vacancies fall for commercial properties into 2013, owners look to pad their profits by increasing rents. As such potential occupants should protect their bottom lines now by locking in lower rates with long-term occupancy plans. Private property owners and landlords, too, may try to capitalize off of increased property values, so renters beware.

Increasing monthly rent payments might just be enough to turn some renters into buyers as they look to invest in their own property. “There comes a point when you have to evaluate how much you’re wasting on rent and how much you could be putting into equity,” says Erika Snider, credit consultant for rent to own website, HomeStarSearch.com. He suggests that low interest rates, an abundance of available properties, and a wealth of leasing options make for a real estate atmosphere that is still largely in favor of consumers.

Take, for example, California, which is experiencing a gain in sales as homebuyers jump on historically low interest rates and reasonable prices. This is good for new homeowners, but for how long? Statistics show that 30% of current California homeowners are underwater on their mortgages and will affect the market as they decide whether to stick it out or to list their properties. And California is but a portion of the national picture; Zillow reports that 31.4% of U.S. homeowners are currently upside-down on their mortgages as the fed frantically scrambles for a way to help them out and boost the economy.

So while increasing home prices seems, on the surface, like a positive step, the real estate market is far from a full recovery. The upcoming year will see more increases in property values and low interest rates, but it will be far from a housing boom. It will be interesting to see if government-backed refinancing options – which aim to free up income for underwater mortgage holders – are the cure for a sluggish economy. Will homeowners take their excess funds straight into the marketplace or will they stash it away for the next financial doomsday? Stay tuned…

Wednesday, November 28, 2012

Bay Area Remains Most Expensive Real Estate Market in US


The success of the technology industry and desirable location are continuing to influence home listing prices in the San Francisco Bay Area, elevating it to one of the priciest real estate markets in the country. Today, the Home Listing Report (HLR) revealing several of the country's most expensive real estate markets are in Northern California. Google, Apple, Facebook and Stanford University are all located within 15 minutes of this year's most expensive market, Los Altos, Calif.,where the average listing price of a four-bedroom, two-bathroom home is 1,706,688.

"The success of many of our native tech companies has shined aspotlight on Silicon Valley and our real estate market in the SanFrancisco Bay Area," said Rick Turley, president of Coldwell Banker Residential Brokerage in the San Francisco Bay Area. "Listing pricesin our market are a product of ongoing high demand, projectedpopulation growth and the low inventory levels of homes in what is one of the most desirable locations to live."

In contrast, the most affordable market this year is Redford, Mich.,where a similar home, four-bedrooms, two-bathrooms, is listed at $60,490 -- a listing price difference of more than 1.6 million. Infact, 28 homes can be purchased in Redford for the price of a similarhome in Los Altos.
Overall, the report found the average listing price of afour-bedroom, two-bathroom home in the U.S. to be 292,152. Affordability remains strong in many markets across the country as 36 percent of the markets analyzed by the report had an average homelisting price of less than 200,000 for four-bedroom, two-bathroom homes.

About America's Most Expensive Markets:
The five most expensive markets are all in California, with four inthe San Francisco Bay Area. Los Altos, Calif. tops the list, followedby Newport Beach (1,658,000), Saratoga (1,582,434), Menlo Park(1,506,909) and Palo Alto (1,495,364). But even with these highpriced markets, California was not the most expensive state. Theaverage listing price of a four-bedroom, two-bathroom home inCalifornia (431,625) is less than both Hawaii (742,551) and Massachusetts (489,063).

Tuesday, November 20, 2012

Positive Real Estate Trend Continues: Sales, Prices, Confidence Up


The latest real estate market trends show continued improvement with an increase in existing home sales and prices, and rising confidence among home builders, according to industry data released today.

Existing home sales rose 2.1 percent in October, while median home prices posted a year-over-year gain of 11.1 percent, according to a report released today by the National Association of Realtors (NAR). Builder confidence rose for the seventh straight month to a high last seen in May 2006, according to the Housing Market Index released today by the National Association of Home Builders or NAHB.

Total existing home sales sold at a seasonally adjusted annual rate of 4.79 million in October, up from 4.69 million in September, despite the regional impact from Hurricane Sandy on real estate market trends, according to the NAR. October sales are 10.9 percent higher than the 4.32 million pace for October 2011.
“We expect an impact on Northeastern home sales in the coming months from a pause and delays in storm-impacted regions,” Lawrence Yun, NAR chief economist, said in a statement.

The national median existing home price for all housing types, including single-family homes, townhomes, condominiums and co-ops, was $178,600 in October, the eighth consecutive month of annual increases.
“Rising home prices have already resulted in a $760 billion growth in home equity during the past year,” Yun said. “Given that each percentage point of prices appreciation translates into an additional $190 billion in home equity, we could see close to a $1 trillion gain next year.”

Confidence among home builders rose 5 points to 46 on the NAHB Housing Market Index. “While our confidence gauge has yet to breach the 50 mark – at which point an equal number of builders view sales conditions as good versus poor – we have certainly made substantial progress since this time last year, when the HMI stood at 19,” the association’s chief economist, David Crowe, said in a statement.

The index tracks home builders’ perception of sale, sales expectations and traffic of prospective buyers. Builders’ reported an 8-point improvement to 49 in their view of current sales conditions, while the outlook for sales over the next six months rose 2 points to 53. Perceptions of traffic remained at 35 from the previous month.

Thursday, November 15, 2012

California Home Sales Hits 3 Year High


California's real estate market bucked the typical fall slowdown last month, with buyers snapping up pricier homes and sales roaring up 18% over the prior month. Sales hit a three-year high for an October, rising 25% from the same month last year. The median sale price for a Southern California  home last month was $315,000, equal to September and up 17% from October 2011, according to real estate research firm DataQuick.

A decline in the number of foreclosed homes has caused a shortage of inventory in entry-level neighborhoods, pushing up home prices. Demand from investors also remains strong, with these buyers snapping up a near-record level of homes last month.

The rebound stems from more people chasing fewer homes. Interest rates remain near record-low levels, luring buyers. Investors with cash have poured into the market looking for cheap properties to flip or rent. And foreclosure resales have sunk to a five-year low, tightening the supply of cheap homes.

An estimated 21,075 newly built and previously owned houses and condominiums sold throughout the region last month. Coastal markets saw the biggest increases in sales — though every county posted double-digit gains compared with October last year. Orange County saw the biggest surge, with sales up 41%. Ventura rose 35%, San Diego, 31%, Los Angeles, 25%, San Bernardino, 18% and Riverside 13%.

Absentee buyers — investors and some second-home buyers — snapped up a near-record 28% of homes throughout the Southland last month. These investors paid a median $245,000, a 23% increase from October last year.

A recent report by real estate website Zillow showed that many investors and others are paying market value for foreclosed homes in the region, erasing the discount between foreclosed homes and regular properties. Discounts were marginal on bank-owned homes in September, with the discount in the Inland Empire just 2% and in the Los Angeles area 4% in September, Zillow said.

Bruce Norris, president of Norris Group, an investment company in Riverside that buys foreclosed homes, said he expects prices to increase in coming years as the Obama administration has encouraged banks to curtail foreclosures. That will push up prices, he said.

"It is policy driven," Norris said. "Since the policy is going to continue … you are about to see a pretty substantial price increase within the next two years." Indeed, the high level of affordability ushered in by the housing crash could erode quickly in California. This week the California Assn. of Realtors reported that homes in the state are getting less affordable as property values rise. The group estimated that 49% of home buyers in the third quarter could afford a median-priced house in California, a decline from 51% last quarter. The rise in prices is offsetting the benefit to home shoppers from low mortgage interest rates.

Christopher Thornberg, a principal at Beacon Economics and one of the first to call attention to the housing bubble, said home shoppers should expect expensive housing in the Golden State for the foreseeable future. The reason: Construction of new homes remains highly expensive for builders.
"Why would it stop?" he said. "The economy is growing. Short of a fiscally led second recession, there is no reason in the world that it's going to do anything but to continue."

The region's lowest-cost areas — often those the most starved for inventory these days — posted the weakest sales numbers last month, according to DataQuick. The number of homes that sold below $200,000 in the region dropped 11% from October last year. Sales in these markets have slowed because of the drop in foreclosures, while increased demand has pushed up prices.

Sales of previously foreclosed-upon homes made up just 16% of the resale market last month, a drop from 17% last month and 33% in October 2011. Foreclosure resales peaked at 57% in February 2009.
In the meantime, sales surged in several mid- and higher-cost neighborhoods throughout Southern California in October, DataQuick said. Sales of homes between $300,000 and $800,000 increased 42% year over year. Sales of homes costing more than $500,000 were up 55% and sales of homes more than $800,000 rose 52%.

Bill McBride, lead writer for the housing blog Calculated Risk, said that with the upswing in prices homeowners are encouraged to keep their homes off the market. "Why is there no inventory? I ask every real estate agent that, just to hear what they tell me. And they say people don't have enough equity in their homes and so they aren't listing them," McBride said. "That is a solid argument. But I also think the people are sensing that prices are going up and there is no urgency to sell."

Sunday, November 4, 2012

Limited Inventory Challenges Homebuyers in 2012


The 2012 annual housing market study by the California Association of Realtors is pointing out what listing agents and brokers have been claiming for many months: Properties are getting multiple offers — especially those priced in the affordable echelon, the C.A.R. report says. Homes are also selling twice as fast as they did in 2011.


Fifty-seven percent of home sales received multiple offers, representing the highest percentage in the last 12 years.

Each home landed 4.2 offers, up from 3.5 in 2011. Lower priced homes, think REO (real-estate owned) or short sales, drew more offers than straight-up sales. Seven out of 10 REOs and short sales attracted multiple offers; equity sales, more than one.
Here are some additional nuggets from the report:
  • Fourty-one percent of the homes sold without a markdown.
  • Equity homes sold faster in 2012 by 35 days. Average days to ink a sale, 32. Last year, it took 67 days to sell a home with equity.
  • REO sales took 30 days, shaving 20 days from the average in 2011.
  • Short sales remain a tough nut to crack: The average sale took 90 days, but is down from 141 days in 2011.
  • Thirty percent of all home buyers paid with all-cash; in 2001, that buy-pool represented only 9 percent.

The C.A.R. survey, a tradition since 1981, is based on random mailings to 15,000 Realtors across California. Realtors were asked to provide information on the most recent sale to close escrow in the second quarter of 2012.

Monday, October 29, 2012

California Housing Market Leads the Way to Recovery in the Wake of Subprime Mortgage Loan Crisi


In the days leading up to the great recession, California led the country in subprime mortgage loans — reckless transactions that played a major role in the housing market bust, both here and throughout the rest of the country. However, a new RealtyTrac data report published in the San Francisco Chronicle shows the California housing market now leading the way to real estate recovery through a combination of reduced defaults, increased demand in move-up markets and lively activity on the part of investors.

After being buried in the aftermath of countless foreclosures following the implosion of the housing bubble, California has finally succeeded in stabilizing the housing market. The latest RealtyTrac data shows U.S. foreclosure filings at their lowest in nearly five years – thanks in large part to a dramatic reduction in defaults throughout California. Initial statewide default filings fell to their lowest point in 69 months, signifying a decrease of 45% compared to this time last year. Meanwhile, home sales in the state’s most populous regions jumped to highest rates since 2006 as of August 2012. Across the nation, housing market trends are mirroring California’s advances” defaults fell by 34% in Arizona, 22% in Michigan and 21% in Georgia, while overall U.S. home values rose by 1.2% relative to last year’s figures.

In addition to reduced defaults, California has also enjoyed a brisk uptake in market activity from investors and move-up buyers, with the bulk of real estate purchase power centered in the coastal markets and moving steadily inland into the autumn months.

From reckless lending to smart investing: the future of California real estate
With California moving swiftly ahead in the direction of real estate recovery, now is the time for move-up buyers to capitalize on comparatively low home prices and historically low interest rates while they still can. Here in Santa Cruz, the time is ripe for qualified buyers in desirable coastal markets.

To learn more contact Authentic Real Estate and find out about the current trend in South Bay Area real estate: http://www.authenticre.com or (831) 426 0294

Tuesday, October 16, 2012

California Homes Prices Predicted to Rise in 2013


California home sales and prices will likely rise this year and in 2013, though low inventory and restricted lending will continue to curb housing market growth, according to a forecast from the California Association of Realtors.

Sales of existing, single-family homes are up 6.5 percent through August compared to the same period last year. After a slight 1.1 percent increase in 2011, CAR expects sales to jump for the second year in a row this year to 530,300 homes, up 5.1 percent from 2011. CAR anticipates a further 1.3 percent increase in 2013, to 530,000 homes.

"The market has improved moderately over the past year, and we expect that to continue into 2013," said CAR President LeFrancis Arnold in a statement.

Arnold said sales would be even higher if inventory were less constrained in markets dominated by sales of bank-owned properties, particularly in the Central Valley and Inland Empire, "where there is an extreme shortage of available homes. Sales will be stronger in higher-priced areas, where there are more equity properties and a somewhat greater availability of homes for sale."

 Leslie Appleton-Young, CAR's vice president and chief economist, said in a conference call that low inventory and "defensive lending" by lenders were "the speed bumps in the California housing highway."
Lenders "are not lending to hold the mortgage. They're lending to sell the mortgage on the secondary mortgage market and they want to avoid having to buy that back," she said.

Wednesday, October 10, 2012

California Foreclosure Inventory Continues to Fall


In another positive sign for the housing market, the nation's so-called shadow inventory of properties in the foreclosure pipeline fell by more than 10 percent in July from the same period a year before, CoreLogic reported Tuesday. The tracking firm in Irvine, Calif., said the number of housing units in jeopardy of foreclosure -- or that lenders have repossessed but not yet listed for sale -- dropped to 2.3 million this July from 2.6 million a year earlier.

"This is yet another hopeful sign that the housing market is slowly healing," said Anand Nallathambi, president and CEO of CoreLogic. The report should be welcome news for homeowners worried that a wave of foreclosure sales might further depress housing values.

The real estate market generally has been on the path toward recovery this year, with home prices pressed upward by the low inventory of homes for sale and by record-low 30-year mortgage rates, now below 4 percent. Experts have pointed to the shadow inventory as a potential threat to the fledgling upturn. Large numbers of foreclosed homes hitting the market could drive prices down.

The improving economy and alternatives to foreclosure, including short sales and loan modifications, have helped prevent homes from becoming part of the shadow inventory. CoreLogic s calculates the shadow inventory by adding the number of homes in foreclosure and those that are bank-owned but not yet for sale. Homes where owners are 90 days or more past due on their payments also are included.


All told, the shadow inventory in the United States was worth about $382 billion as of July, the firm estimated. That's down from $397 billion a year ago, it said. Forty-five percent of all distressed properties are in five states: California, Florida, Illinois, New York and New Jersey, CoreLogic reported


Thursday, September 27, 2012

The Foreclosure Flood That May Never Come


Pro Teck Valuation Services’ September Home Value Forecast Update examines why there will not be a flood of foreclosure housing stock across the U.S. market and how metro areas in Southern California, Texas and Maryland are experiencing positive real estate trends.

“With regard to the U.S. foreclosure inventory, there has been a misperception that it is a problem for the entire market. In fact, it is quite concentrated in specific cities and neighborhoods,” said Tom O’Grady, CEO of Pro Teck Valuation Services. “For this reason, potential buyers who have been waiting for bargain prices in desirable neighborhoods may be disappointed.”

This month’s Home Value Forecast update lists San Diego as one of four Southern California real estate markets in the Top 10 and also examines a 20-year history of the months of remaining housing inventory trends for homes listed for sale in the San Diego, Orange County, and Los Angeles metro areas.

“The current overall months of remaining housing inventory for San Diego, Orange and Los Angeles is below five months, which is the lowest they have been since the market peak in 2005-2006,” added O’Grady. “This is significant because in the Los Angeles market over the past 25 years, whenever this indicator was below five months, the median price increased by close to 19 percent the following year. Of course, it remains to be seen if the same appreciation happens again.”

Home Value Forecast’s September update shows that while all three counties exhibit low overall inventory remaining, there is a fairly wide dispersion when viewed by home value on a price per square foot of living area basis. In areas, where the price per square foot is less than $550, there is less than six months of remaining inventory. However, there are greater months of remaining inventory of homes with higher prices, especially in San Diego.

This month’s Home Value Forecast update also includes a listing of the 10 best and 10 worst performing metros as ranked by its market condition ranking model.

“The top ranked metros this month represent an interesting mix of U.S. real estate markets. In addition to the Southern California markets, there are four metros top ranked in Texas and one in Maryland,” said Michael Sklarz, Principal of Collateral Analytics and contributing author to Home Value Forecast. “It is interesting to note that all of the metros in the top 10 are exhibiting positive trends and that all have experienced significant declines in active listing counts over the past year, resulting in fewer months of remaining inventory and tighter markets.”

September’s top CBSAs include:
  • Oxnard-Thousand Oaks-Ventura, CA
  • Seattle-Bellevue-Everett, WA
  • San Diego-Carlsbad-San Marcos, CA
  • Los Angeles-Long Beach-Glendale, CA
  • Santa Ana-Anaheim-Irvine, CA
  • Houston-Sugar Land-Baytown, TX
  • Baltimore-Towson, MD
  • Fort Worth-Arlington, TX
  • Austin-Round Rock-San Marcos, TX
  • San Antonio-New Braunfels, TX
“This month, some of the bottom CBSAs are in the Northeast again and continue to have double digit months of remaining inventory. However, a number of the metro areas have a fair percentage of trends moving in a positive direction, which is quite a difference from a year ago,” added Sklarz.

The bottom CBSAs for September were:
  • New Haven-Milford, CT
  • Bridgeport, Stamford, Norwalk, CT
  • Augusta-Richmond County, GA-SC
  • Rochester, NY
  • Spokane, WA
  • Portland-Vancouver-Hillsborough, OR-WA
  • New York-White Plains-Wayne, NY-NJ
  • Edison, NJ
  • Nassau-Suffolk, NY
  • Newark-Union, NJ-PA

Sunday, September 16, 2012

Homeowners Now In Control of Housing Market


Radar Logic and other people are still cranky about the housing market. They opine that the recent strength in national housing price figures won't last because of something latent lurking out there on the supply side. In statistics, latent variables can be perfectly legitimate -- but if it results in perennially brushing aside contradicting observable data, it begins having a legitimacy problem.

There are clearly two trends in the housing market that can be observed directly. One is the significant decline of what some people call transactional inventory and the market share of distressed sales. The other is that home prices are actually rising lately in many areas. I dare to infer that those two trends are highly correlated. I have been seeing things lately about this -- like strong statistical correlations between home price trends and low unsold inventory and declining distressed
sales shares


In this context, recent home price stats by Clear Capital, is telling. Not only did they observe the “fourth consecutive month of home price gains” in August 2012, but non-investor home buyers made up an increasing chunk of the sales mix and non-distressed price gains outpaced REO prices. According to Dr. Alex Villacorta, Clear Capital’s research guru, the shift from the investor to the owner-occupied sector “could have a far reaching effect, even in smaller markets." Nationally, home prices advanced 1.9% over the quarter in August, essentially unchanged from 2.0% in July.

Yearly home price growth also rose to 2.9% in August from a 0.7% annual increase in July 2012. Clear Capital finds that major California areas experienced quarterly and annual home price appreciation in August, that the home price recovery continues to move inland, and that the REO market share in transactions is dropping. I can’t wait to see what the seemingly infinite inference chains of the conspiracy theorist will have to say about that. Ah, I know, it has to do with foreclosure disposition bottlenecks … yawn! Meanwhile, let’s enjoy the rise of the owner-occupied market as the potentially significant event it might be, I dare to infer (until observable facts say otherwise.)

Wednesday, September 12, 2012

The Rise in Real Estate Is Sustainable

The cover story for the September 10th weekly magazine Barron's is on the recent surge in real estate and how the rise in property prices is no fluke. In the article by Jonathan R. Laing titled "Happy at Last," readers are given a cautiously optimistic assessment of what has already been a well established trend in the real estate market. A distinction in this article is the confidence with which many professionals believe that the current rise in real estate is sustainable for the foreseeable future.

We agree that real estate will have a sustainable trajectory upward as we outlined in our December 10, 2010 article titled "Real Estate: The Verdict is In". We believe that the clear reversal of the indicators that we discussed at the end of 2010 has proven that the real estate market has bottomed. The following is a review of the indicators that we track that have definitively shown that the direction is up.

As can be seen in the chart below, U.S. housing starts bottomed in January 2009 and started to base over the next 2 years. Two months after our December 2010 article, housing starts began to increase at a healthy pace.


The broad basing pattern in U.S. housing starts and the relatively mild increase, as compared to the 1991 bottom, seems to indicate a more realistic view on expectations for real estate going forward.

The next chart that we find useful for determining the direction of the real estate market is the real estate loans at all commercial banks. When we published our December 2010 article, we said that the bottom had occurred in April 2010. In fact, the actual bottom took place in April 2011 as shown below.


The real estate market cannot thrive in an environment where lenders are unwilling to lend. Tracking the real estate loans by banks is instructive as to what the direction might be. Our assessment of this indication suggested that on a relative basis, the declining trend was at, or near, an end. The dramatic increase in lending since early 2011 has helped push select real estate markets higher.

Much of the research analysis that we do on the topic of real estate is based on the work of Roy Wenzlick. If there ever was a scientifically accurate approach to analyzing the real estate market, Roy Wenzlick perfected it. Anyone who read his newsletter, The Real Estate Analyst (published from 1932-1974), would have thought that Wenzlick was strictly a statistician. However, while Wenzlick was a compiler of significant amounts of data on real estate, he also believed that the market price for properties ran on a clearly defined cycle. On each chart, we have indicated Wenzlick's last estimated low for real estate based on that cycle.

The chart below illustrates the importance of considering Wenzlick's estimate of the real estate cycle because it isn't the rise that we're interested in as much as when the next decline begins and when the bottom might occur.


The real estate cycle that Roy Wenzlick adheres to pointed to a low in 1991 and a low in late 2009. In the Federal Housing Finance Agency's House Price Index for the nation, we can seen that 2009 was not quite the end of the decline for real estate. Knowing that all cycle analysis is a rough estimate, at best, we hedged our view to include the possibility that the bottom would occur as late as the end of 2010.

Thursday, August 30, 2012

What The Future Holds for Home Prices

[image]

U.S. home prices rose in June from a year earlier for the first time in nearly two years, according to data released Tuesday. Is this the start of a bounce back for housing, or is it just a cheerful blip in the numbers before prices resume their fall?

Bet on neither. Instead, assume for planning purposes that U.S. house prices will rise by an average of 2.3% a year over the next decade. Here's why: House pricestend to track the rate of inflation over long time periods (see chart). After all, inflation is the gradual rise in the cost of ordinary goods and services, and houses are boxes made from ordinary goods and services -- lumber, copper, carpentry and so on.

If house prices either outpaced or lagged behind the inflation rate over long time periods, houseswould become either infinitely unaffordable or cheap. Of course, that doesn't happen. Booms and busts tend to offset each other, leaving house prices in sync with other prices. That's what has happened over the past dozen years or so.

Predicting the inflation rate is difficult, but the work is already done. That's because of a special kind of bond called Treasury inflation-protected securities, or TIPS. These give investors both a stated interest rate and an ongoing principal adjustment based on the consumer price index, the main measure of inflation. Regular Treasurys give investors only the stated yield.

The difference between TIPS yields and regular Treasury yields, then, is equal to investors' collective bet on the rate of inflation. Right now, that spread is 2.3 percentage points on 10-year issues.

Investors should assume that rate for the next 10 years of annual inflation -- and house price gains.
Housing bears will point out that the recent year-over-year price gain is just 0.5%. All of it may be due to a recent drop in mortgage rates luring buyers, which isn't likely to repeat. And last year made for an easy price comparison, because prices dropped following the expiration of housing stimulus programs. Indeed, house prices may already be falling again. The latest Case-Shiller reading is for June, and really, it reflects purchases that were inked a few months prior.

Housing bulls counter that mortgage delinquencies are down, new home sales are up and affordability has been restored.

They each make good points -- and their views are already reflected in market prices for houses, which is why prospective buyers should ignore them. They should also ignore broker claims about a particular area being an up-and-coming one or a deep value. Those sentiments are priced in too.
Buyers should instead use their 2.3% house gain forecast in one of those renting-versus-buying calculators available. Good ones typically ask the user to plug in forecasts for their annual rent increases, annual house price increases and the rate of inflation. Use the same number for each (2.3% or whatever the current spread between TIPS and regular Treasury yields suggests).

Of course, house prices may not exactly track inflation over the next 10 years. They could rise more or less, and history suggests price gains will vary sharply by market. Even in the same market, some buyers will get better deals than others. But the point of the forecast is to base housing decisions on a sober look at likely outcomes rather than hope or hype.

Homeownership still looks like a good deal in most markets, but that has little to do with June's price rise or the possibility of timing the market.

Sunday, August 19, 2012

"Second Crash" Fears Recede Our Bank's Shadow Inventory


For years, some real estate analysts feared that banks would suddenly release a wave of foreclosed houses, swamping the local housing market and sending house prices into a second collapse.
That second tsunami isn't happening, according to an analysis by the North County Times.
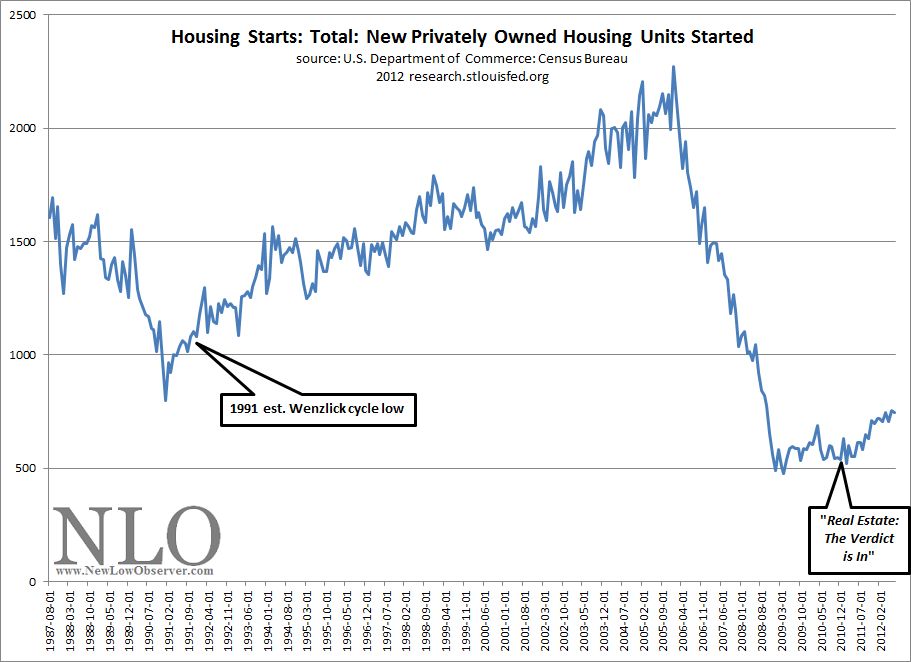
A house-price crash precipitated a series of foreclosure spikes in 2007 and 2008, leaving banks holding thousands of houses and struggling to hire staff to process them.
After 2009, real estate agents and some analysts became convinced that lenders were holding off on foreclosures, and sitting on foreclosed properties in order to prop up prices, creating a "shadow inventory."
They feared lenders would have to process and release all those houses ---- sending house prices, which have been bouncing along a price bottom for two years, into another downward spiral.
Instead, the number of homes in default has been steadily declining in the region, thanks to a host of programs from government and private banks and a turn toward short sales, in which borrowers sell their properties for less than they owe.
And once lenders have foreclosed on properties, they have moved quickly to sell them, so the stock of properties held by banks is declining, according to an analysis of foreclosure data by the North County Times.
No conspiracy
"The idea that the banks are intentionally doing anything is itself ridiculous," said Chris Thornberg, a principal and an economist with Beacon Economics near Los Angeles. "There's not some Illuminati of banks. They're not holding back units, they're selling them as fast as they can."
Thornberg has long argued against a second wave of foreclosures, but other analysts worried about the shadow inventory.
Tim Ellis, an analyst at national real estate brokerage Redfin, has been among the most concerned, writing onRedfin's blog in February: "The fact remains that the banks are currently sitting on tens of thousands of homes across the country that they have foreclosed and not yet listed, along with tens of thousands more homes somewhere in between the first missed payment and the actual foreclosure.
"... Any sign, however slight, that prices may be on the rebound will cause banks to release more of their inventory onto the market, along with a wave of pent-up supply from would-be sellers on the margin to rush to list their homes to take advantage of the 'recovery.'"
Locally, the sentiment was similar.
Seeing shadows
"There's a lot of shadow inventory," Jeff Jenkel, a Rancho Bernardo real estate agent, said in May. "And so at some point it's going to get a lot worse before it gets better."
Even Douglas Duncan, chief economist for government lending giant Fannie Mae said in December, "The shadow inventory has to be worked through."
Do lenders hold properties off the market? Chase Bank responded to the North County Times' question, speaking only for themselves:
"No," said Lisa Shepherd, vice president of Chase REO and property preservation. "The only time that you would see a property that's not available for sale that goes through foreclosure is if it's in some sort of legal action that prohibits me from selling it."
Lenders sold off the majority of homes they foreclosed, according to a North County Times analysis of foreclosure data from ForeclosureRadar and transactions from the San Diego and Riverside county assessor's offices.
Fire sale
Between Jan. 1, 2007, and June 30 this year, lenders foreclosed on 16,570 houses in North San Diego County. By the end of that period, lenders held 780 houses ---- they'd sold off 95 percent of the houses they'd taken back.
The same trend holds for Southwest Riverside County over the same period: Lenders foreclosed on 36,037 houses, and by the end of June possessed 1,625, which is to say, they sold 95.5 percent of all the houses they'd foreclosed.
At a peak in fall of 2008, lenders held 1,315 houses in North County and 3,173 houses in Southwest Riverside.
If the lenders had the capacity to drop all those houses on the market right away, they probably could have affected prices: All those houses would have represented one-third of North County listings in the period, and half of Southwest County listings. Even this year, if lenders put all their houses on the market, it would change pricing.
But lenders can't flip a house instantly, said Shepherd from Chase.
"If the property is vacant and there are no issues, it should be anywhere from 30 to 45 days to get it on the market," she said. To sell the property, "on average, and especially in the state of California, anywhere from 60 to 90 days."
Inventory turns over
In 2007, lenders needed a median of 10 months to sell a house they'd just foreclosed on. By 2008, they needed a median of six months. At the end of 2011, they'd reduced that median to four months, in North San Diego and Southwest Riverside counties.
"What that means is rather than mismanaging things and holding things back, they (lenders) are reducing their inventory." said G.U. Krueger, a housing economist with Krueger Economics in Los Angeles.
Even as lenders have become more efficient at selling the houses they foreclose on, they're also foreclosing on fewer of them, largely thanks to government refinance and loan modification programs, private loan modification programs, and a new focus on short sales.
Those programs have helped lower the number of people in default. In San Diego County, as of June 30, there were 6,539 people in default on their loans but not yet foreclosed, down 35 percent from three years earlier, according to ForeclosureRadar. The number of people in default in Riverside County fell 34 percent over the same period to 8,821.
Those programs also have sharply reduced the number of foreclosures in the region: In July, lenders foreclosed on 223 houses in Southwest Riverside and on 126 houses in North County.
The result has been a steep decline in the number of houses available for prospective buyers ---- listings in both regions are down one-third from a year ago, according to the North San Diego County Association of Realtors and Redfin.
The tight inventory of homes for sale has led to bidding wars among buyers for the first time since the boom ended in 2006, and a 
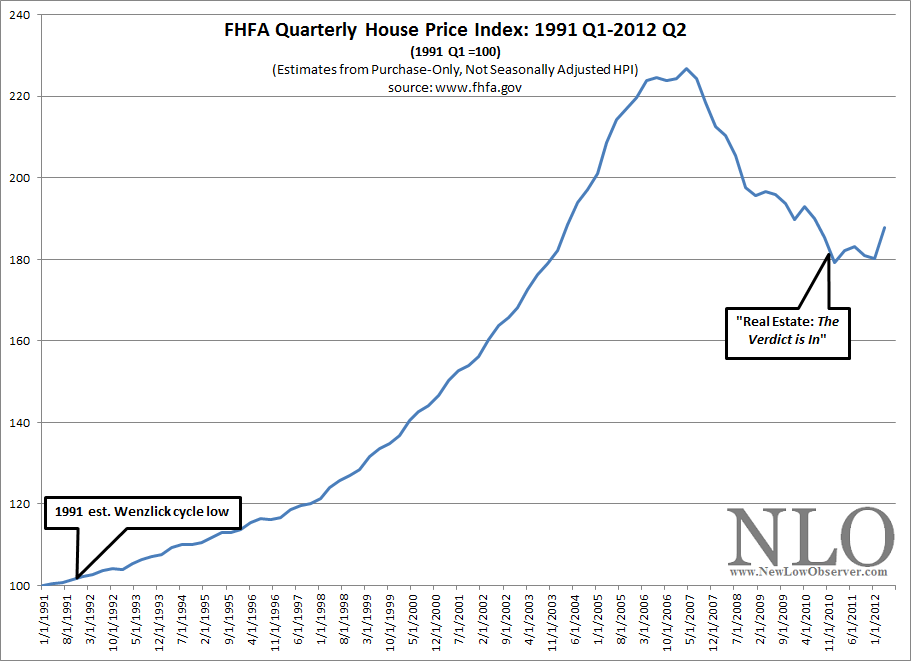
stabilization of home prices in the region.
"People are starting to come out and buy homes," said Nathan Moeder, an economist and principal with London Group in San Diego. "There's going to be demand to suck up those homes."

Wednesday, August 8, 2012

Deliquent Mortgages Reported at 3 Year Low


U.S. homeowners are getting better about keeping up with mortgage payments, driving the percentage of borrowers who have fallen behind to a three-year low, according to a new report.


Still, the rate of decline remains slow, credit reporting agency TransUnion said Wednesday. The percentage of mortgages going unpaid is unlikely to return anytime soon to where it was before the housing market crashed.

Some 5.49 percent of the nation's mortgage holders were behind on their payments by 60 days or more in the April-to-June period, the agency said. That's the lowest level since the first quarter of 2009.

The second-quarter delinquency rate is down from 5.82 percent in the same period last year, and below the 5.78 percent rate for the first three months of 2012. The positive second-quarter trend coincided with an improving outlook for the U.S. housing market.

A measure of national home prices rose 2.2 percent from April to May, the second increase after seven months of flat or declining readings. Sales of new homes fell in June after reaching a two-year high in May. Sales of previously occupied homes also declined in June, but were higher than a year earlier.

Home refinancing surged in the second quarter, as interest rates sank to historic lows. And more borrowers with underwater mortgages -- or home loans that exceed the value of the home -- refinanced through the government's Home Affordable Refinance Program than ever before.

"More people are making their payments, and that's great," said Tim Martin, group vice president of U.S. housing for TransUnion. "I expected a little bit better, but maybe we'll see some more of that pick up in [the third quarter]."

Even as housing trends turned positive earlier this year, the U.S. economy began to show signs of faltering. The national unemployment rate remained stuck at 8.2 percent, and the pace of job growth slowed sharply, with employers adding an average of only 75,000 jobs in the April-June quarter. Hiring appeared to pick up in July, however, with employers adding 163,000 jobs.

TransUnion anticipates the mortgage delinquency rate will continue to decline. But it doesn't see it falling below 5 percent this year.

The national delinquency rate remains well above its historical range, an indication many homeowners are still struggling five years after the housing downturn.

Before the housing bust, mortgage delinquencies were running at less than 2 percent nationally. It took about three years after the housing market crashed for the delinquency rate on mortgages to climb to a peak of nearly 7 percent in the fourth quarter of 2009. The rate has been trending down since then. Home prices need to recover further for the delinquency rate to decline.

At the state level, Florida led the nation with the highest mortgage delinquency rate of any state at 13.48 percent, down from 13.91 percent a year earlier. It was followed by Nevada at 10.85 percent; New Jersey at 8.15 percent; and, Maryland at 6.79 percent.

The states with the lowest delinquency rate were North Dakota at 1.32 percent; South Dakota at 1.94 percent; Nebraska at 2.24 percent; and, Wyoming at 2.41 percent.

Foreclosure hotbeds Arizona and California each saw marked improvement during the second quarter.
California's mortgage delinquency rate fell nearly 22 percent to 6.13 percent from a year earlier, while Arizona's declined 21 percent to 6.14.

One reason for the sharp declines in mortgage delinquency rates in those states is that homes tend to move faster through the foreclosure process than in Florida, New York and other states where the courts play a role in the process. That leads to logjams of cases involving home loans that may have gone unpaid for two years or more.

"You have states that are taking a long time to work through the delinquencies that they have, which is keeping their numbers up," Martin said.


Monday, August 6, 2012

Beautifully Renovated and Affordable Home for Sale

    Soquel Condo For Sale
                $299,000

* 3 Bedrooms, 1.5 Bathrooms
* 1083 Square Feet
* Private Garage
* Landscaped Front and Back Patio

                 Features
* New Granite Counter Tops
* New Kitchen Appliances
* New Carpet Throughout
* New Fixtures Throughout Home
* New Vanities in Bathrooms
* New Tile Floors in Bathrooms
* New Doors and Hardware

Centrally Located. Walking distance from Cabrillo College. Short drive to schools, shopping, churches and beach. Turn key home in move in condition!


Call Greg for more information!
(831) 426-0294 Office
(831) 454-6846 Cell


Thursday, July 19, 2012

Are Real Estate Bellwethers Ringing?


In case you’re still a nonbeliever that housing has finally crawled its way into recovery mode, ask yourself: What are the bellwether indicators of the early stages of a rebound? You can probably rattle them off.
  • Rising home prices in the vast majority of the country’s major markets.
  • Tightening of the supply of houses listed for sale.
  • Quickening rates of turnover of the available housing inventory – how fast houses listed for sale are put under contract

You could also add sustained periods of rising single-family housing starts (they were up in June for the fourth straight month), increased number of applications for home mortgages and more pending home sale contracts. All positive.
But let’s stick with the three key indicators bulleted above – prices, inventory and time on the market – because at the moment they are eye-openers. Though there are regional and local pockets where prices haven’t stabilized – notably in Pennsylvania, portions of New Jersey and the 

Midwest –  the vast majority of  U.S. markets are now seeing at least modestly rising prices compared with year-ago levels, and thus far fewer houses available to buy, according to the Realtor.com Real Estate Data Trends for June 2012.
In 99 percent (144) of the 146 major markets tracked by Realtor.com, which has access to listing and sales data from hundreds of Multiple Listing Services around the country, median prices rose during the month of June by 2.7 percent over year-earlier levels. Twelve months ago, by contrast, the same survey found prices  declined by more than 1 percent in the majority (54 percent) of markets – 79 out of 146.
What’s  more significant, however, is what’s happening to local inventories of houses for sale.  They are plunging, and what’s on the market is generally moving quickly. On a national basis, the available stock of listings, i.e. what’s available for shoppers to buy, is down by 19.4 percent compared with the year before. But in 17 large metropolitan areas, inventory is down by more than 30 percent. In Oakland, California, for instance, there are 58 percent fewer homes listed for sale than 12 months ago. In Seattle, inventory is 43 percent lower.  In San Francisco and Phoenix, the drop has been just under 40 percent.  The median age of the national inventory – 84 days – is the lowest it’s been since early 2007, which means what’s getting listed isn’t sticking around nearly as long as it did a few years back.
These are extraordinary numbers, and in some cases they are helping to fuel multiple bidding situations on the remaining stock of houses available for sale. A handful of metropolitan areas that were badly battered during the bust are now reporting double digit listing price increases. Phoenix’s median list price is  up 32 percent year-over-year. Miami is up 14 percent. Detroit – yesDetroit – is up 10 percent.
But big rebounds in median prices aren’t limited just to localities with low home costs and lots of foreclosures. Three of the highest costing markets in the U.S. have experienced robust increases from June of last year through this June: San Francisco’s median is back up to $725,000, a 15 percent-plus gain.Washington, D.C.’s median of $425,000 is up 13.6 percent. And Santa Barbara, California, is simply off the charts, with prices one-third higher than they were 12 months ago.
Boom is a bad word in real estate these days, so let’s not apply it to any of these situations. But rebound or modest recovery? Those terms are hard to dispute.

Monday, July 9, 2012

Brace Yourself: Home Prices Back on the Rise


House prices, after falling for more than five years, are rising again. All the major sales-price indexes show that there have been modest national increases in recent months, even after adjusting for seasonal patterns.
When foreclosures and distressed sales are excluded from the data, prices are up even more. And we should expect further gains: The asking-price index, a leading indicator of sales prices, published by Trulia Inc. (where I work), climbed at an annualized rate of 3.3 percent in the second quarter of this year, adjusted for mix and seasonality, and rose in 84 of the 100 largest U.S. metropolitan areas.

Of course, if the U.S. economy falters, due to a deepening of the economic crisis in Europe or a wave of foreclosures, prices may reverse. For now, though, the increases are widespread. For the real-estate market and housing policy, this is cause for relief, but also for some concern.
One immediate effect of the price turnaround is that inventory tightens. In the past year, beginning even before prices rose, the inventory of listed homes shrank 20 percent, due to fewer foreclosures for sale and little new construction. Smaller inventory contributes to price increases; when there are fewer homes available, sellers can ask more. In some local markets, bidding wars have returned. Now, rising prices could even accelerate the decrease in inventory in the short term, as buyers act quickly in hopes of paying as little as possible, and sellers hold off listing their homes in anticipation of further price increases. In fact, 61 percent of people do expect prices in their local market to rise in the next year, according to a recent Trulia survey.

Sales Effect

In the longer term, if rising prices last, inventory will grow. Higher prices will encourage more owners to sell, including some who have been “underwater” on their mortgages, as well as banks holding portfolios of foreclosed homes.
Rising prices will also cue housing developers to accelerate construction. After overbuilding during the real- estate bubble, the construction industry has been very slow to recover. New-home starts are still less than half of normal levels, and construction jobs now account for a smaller share of economy-wide employment -- 4.1 percent -- than at any time since 1946. If rising prices nudge construction closer to normal, the housing market might finally contribute to, rather than hold back, the general economic recovery.
Rising prices should also take some pressure off policy makers to “fix” the housing market, and make some mortgage- modification programs more feasible. In particular, shared- appreciation loan modifications -- in which a lender or government agency reduces the amount of principal a borrower owes in exchange for a share of any future price appreciation -- become possible when there is a reasonable chance that prices will go up. Crucially, underwater borrowers -- those owing more on their mortgages than the property is worth -- who expect prices to rise have less incentive to default on their loans and abandon their homes.
Yet along with rising prices come two serious concerns.
First, higher prices make homes harder to afford again. When prices plummeted post-bubble, concerns about affordability faded. Even now rents are gaining faster than home prices, according to the Trulia Rent Monitor, which makes owning a better bargain than renting. Still, rising prices make it harder for renters to buy. And, in markets such as coastal California andNew York City, where new construction is limited by geography and regulations, high prices put homeownership out of reach for many residents.

Building Rules

While San Francisco is too beautiful and Manhattan too productive ever to become cheap places to live, local policy makers could make homes in expensive cities easier to afford by loosening restrictions on new construction. They could allow higher densities, as California is attempting to do near transit stations. In Washington, they could relax the height limit. And everywhere they could simplify and clarify the rules for approving projects. More construction in cities would mean less of it pushed out to sprawling exurban areas, where overbuilding during the bubble led to some of the nation’s most widespread foreclosures.
The second reason for concern over rising prices is that they fuel optimism. Some optimism is desirable, but unchecked optimism creates bubbles. In a recent Trulia survey, 58 percent of people said they expect prices in their local market to return to their previous peak in the next 10 years. In Pittsburgh, Houston and other markets where prices slipped only slightly during the recession, it’s plausible that they will again reach their previous peak. But even in the hardest-hit markets, such as Las Vegas and Sacramento, where prices rose to unsustainable levels and then fell by half or more, 56 percent of people still expect them to rise to their previous peak in the next 10 years. Such optimism can lead to a bubble if people pay more for homes that they expect to appreciate.
To ensure that rising prices and renewed optimism don’t inflate a new bubble, we must not encourage homeownership and housing construction beyond what our income and demographics can support.
Although full recovery in housing is still years off, rising prices will start reshaping the market right away -- for better and for worse.