Thursday, September 27, 2012

The Foreclosure Flood That May Never Come


Pro Teck Valuation Services’ September Home Value Forecast Update examines why there will not be a flood of foreclosure housing stock across the U.S. market and how metro areas in Southern California, Texas and Maryland are experiencing positive real estate trends.

“With regard to the U.S. foreclosure inventory, there has been a misperception that it is a problem for the entire market. In fact, it is quite concentrated in specific cities and neighborhoods,” said Tom O’Grady, CEO of Pro Teck Valuation Services. “For this reason, potential buyers who have been waiting for bargain prices in desirable neighborhoods may be disappointed.”

This month’s Home Value Forecast update lists San Diego as one of four Southern California real estate markets in the Top 10 and also examines a 20-year history of the months of remaining housing inventory trends for homes listed for sale in the San Diego, Orange County, and Los Angeles metro areas.

“The current overall months of remaining housing inventory for San Diego, Orange and Los Angeles is below five months, which is the lowest they have been since the market peak in 2005-2006,” added O’Grady. “This is significant because in the Los Angeles market over the past 25 years, whenever this indicator was below five months, the median price increased by close to 19 percent the following year. Of course, it remains to be seen if the same appreciation happens again.”

Home Value Forecast’s September update shows that while all three counties exhibit low overall inventory remaining, there is a fairly wide dispersion when viewed by home value on a price per square foot of living area basis. In areas, where the price per square foot is less than $550, there is less than six months of remaining inventory. However, there are greater months of remaining inventory of homes with higher prices, especially in San Diego.

This month’s Home Value Forecast update also includes a listing of the 10 best and 10 worst performing metros as ranked by its market condition ranking model.

“The top ranked metros this month represent an interesting mix of U.S. real estate markets. In addition to the Southern California markets, there are four metros top ranked in Texas and one in Maryland,” said Michael Sklarz, Principal of Collateral Analytics and contributing author to Home Value Forecast. “It is interesting to note that all of the metros in the top 10 are exhibiting positive trends and that all have experienced significant declines in active listing counts over the past year, resulting in fewer months of remaining inventory and tighter markets.”

September’s top CBSAs include:
  • Oxnard-Thousand Oaks-Ventura, CA
  • Seattle-Bellevue-Everett, WA
  • San Diego-Carlsbad-San Marcos, CA
  • Los Angeles-Long Beach-Glendale, CA
  • Santa Ana-Anaheim-Irvine, CA
  • Houston-Sugar Land-Baytown, TX
  • Baltimore-Towson, MD
  • Fort Worth-Arlington, TX
  • Austin-Round Rock-San Marcos, TX
  • San Antonio-New Braunfels, TX
“This month, some of the bottom CBSAs are in the Northeast again and continue to have double digit months of remaining inventory. However, a number of the metro areas have a fair percentage of trends moving in a positive direction, which is quite a difference from a year ago,” added Sklarz.

The bottom CBSAs for September were:
  • New Haven-Milford, CT
  • Bridgeport, Stamford, Norwalk, CT
  • Augusta-Richmond County, GA-SC
  • Rochester, NY
  • Spokane, WA
  • Portland-Vancouver-Hillsborough, OR-WA
  • New York-White Plains-Wayne, NY-NJ
  • Edison, NJ
  • Nassau-Suffolk, NY
  • Newark-Union, NJ-PA

Sunday, September 16, 2012

Homeowners Now In Control of Housing Market


Radar Logic and other people are still cranky about the housing market. They opine that the recent strength in national housing price figures won't last because of something latent lurking out there on the supply side. In statistics, latent variables can be perfectly legitimate -- but if it results in perennially brushing aside contradicting observable data, it begins having a legitimacy problem.

There are clearly two trends in the housing market that can be observed directly. One is the significant decline of what some people call transactional inventory and the market share of distressed sales. The other is that home prices are actually rising lately in many areas. I dare to infer that those two trends are highly correlated. I have been seeing things lately about this -- like strong statistical correlations between home price trends and low unsold inventory and declining distressed
sales shares


In this context, recent home price stats by Clear Capital, is telling. Not only did they observe the “fourth consecutive month of home price gains” in August 2012, but non-investor home buyers made up an increasing chunk of the sales mix and non-distressed price gains outpaced REO prices. According to Dr. Alex Villacorta, Clear Capital’s research guru, the shift from the investor to the owner-occupied sector “could have a far reaching effect, even in smaller markets." Nationally, home prices advanced 1.9% over the quarter in August, essentially unchanged from 2.0% in July.

Yearly home price growth also rose to 2.9% in August from a 0.7% annual increase in July 2012. Clear Capital finds that major California areas experienced quarterly and annual home price appreciation in August, that the home price recovery continues to move inland, and that the REO market share in transactions is dropping. I can’t wait to see what the seemingly infinite inference chains of the conspiracy theorist will have to say about that. Ah, I know, it has to do with foreclosure disposition bottlenecks … yawn! Meanwhile, let’s enjoy the rise of the owner-occupied market as the potentially significant event it might be, I dare to infer (until observable facts say otherwise.)

Wednesday, September 12, 2012

The Rise in Real Estate Is Sustainable

The cover story for the September 10th weekly magazine Barron's is on the recent surge in real estate and how the rise in property prices is no fluke. In the article by Jonathan R. Laing titled "Happy at Last," readers are given a cautiously optimistic assessment of what has already been a well established trend in the real estate market. A distinction in this article is the confidence with which many professionals believe that the current rise in real estate is sustainable for the foreseeable future.

We agree that real estate will have a sustainable trajectory upward as we outlined in our December 10, 2010 article titled "Real Estate: The Verdict is In". We believe that the clear reversal of the indicators that we discussed at the end of 2010 has proven that the real estate market has bottomed. The following is a review of the indicators that we track that have definitively shown that the direction is up.

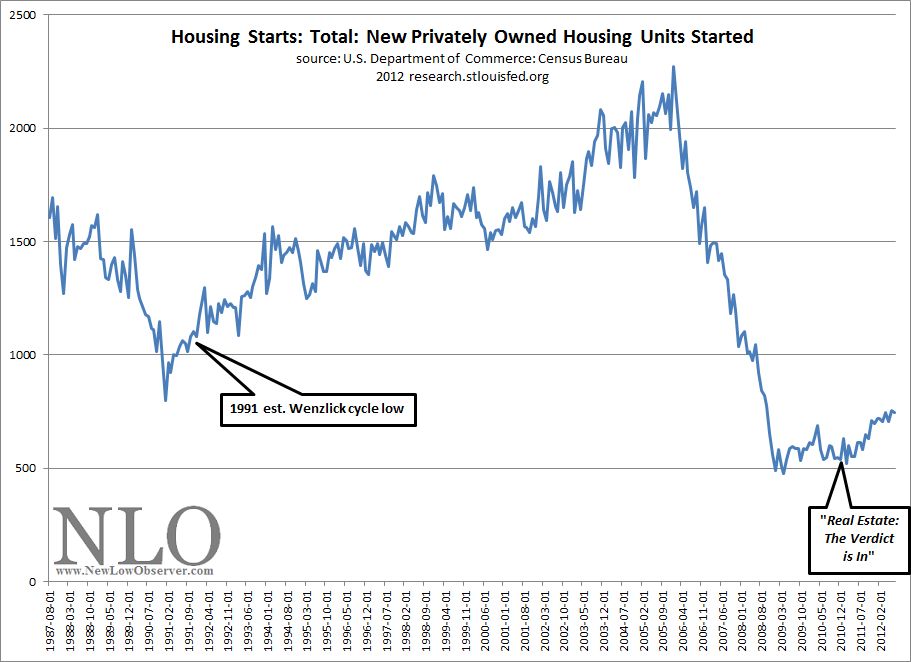
As can be seen in the chart below, U.S. housing starts bottomed in January 2009 and started to base over the next 2 years. Two months after our December 2010 article, housing starts began to increase at a healthy pace.


The broad basing pattern in U.S. housing starts and the relatively mild increase, as compared to the 1991 bottom, seems to indicate a more realistic view on expectations for real estate going forward.

The next chart that we find useful for determining the direction of the real estate market is the real estate loans at all commercial banks. When we published our December 2010 article, we said that the bottom had occurred in April 2010. In fact, the actual bottom took place in April 2011 as shown below.


The real estate market cannot thrive in an environment where lenders are unwilling to lend. Tracking the real estate loans by banks is instructive as to what the direction might be. Our assessment of this indication suggested that on a relative basis, the declining trend was at, or near, an end. The dramatic increase in lending since early 2011 has helped push select real estate markets higher.

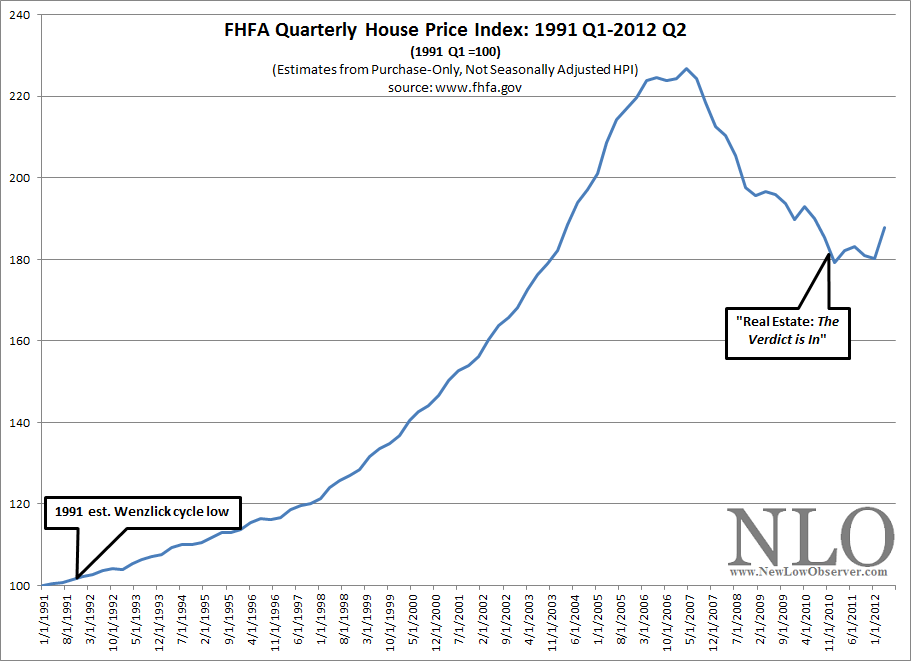
Much of the research analysis that we do on the topic of real estate is based on the work of Roy Wenzlick. If there ever was a scientifically accurate approach to analyzing the real estate market, Roy Wenzlick perfected it. Anyone who read his newsletter, The Real Estate Analyst (published from 1932-1974), would have thought that Wenzlick was strictly a statistician. However, while Wenzlick was a compiler of significant amounts of data on real estate, he also believed that the market price for properties ran on a clearly defined cycle. On each chart, we have indicated Wenzlick's last estimated low for real estate based on that cycle.

The chart below illustrates the importance of considering Wenzlick's estimate of the real estate cycle because it isn't the rise that we're interested in as much as when the next decline begins and when the bottom might occur.


The real estate cycle that Roy Wenzlick adheres to pointed to a low in 1991 and a low in late 2009. In the Federal Housing Finance Agency's House Price Index for the nation, we can seen that 2009 was not quite the end of the decline for real estate. Knowing that all cycle analysis is a rough estimate, at best, we hedged our view to include the possibility that the bottom would occur as late as the end of 2010.

Thursday, August 30, 2012

What The Future Holds for Home Prices

[image]

U.S. home prices rose in June from a year earlier for the first time in nearly two years, according to data released Tuesday. Is this the start of a bounce back for housing, or is it just a cheerful blip in the numbers before prices resume their fall?

Bet on neither. Instead, assume for planning purposes that U.S. house prices will rise by an average of 2.3% a year over the next decade. Here's why: House pricestend to track the rate of inflation over long time periods (see chart). After all, inflation is the gradual rise in the cost of ordinary goods and services, and houses are boxes made from ordinary goods and services -- lumber, copper, carpentry and so on.

If house prices either outpaced or lagged behind the inflation rate over long time periods, houseswould become either infinitely unaffordable or cheap. Of course, that doesn't happen. Booms and busts tend to offset each other, leaving house prices in sync with other prices. That's what has happened over the past dozen years or so.

Predicting the inflation rate is difficult, but the work is already done. That's because of a special kind of bond called Treasury inflation-protected securities, or TIPS. These give investors both a stated interest rate and an ongoing principal adjustment based on the consumer price index, the main measure of inflation. Regular Treasurys give investors only the stated yield.

The difference between TIPS yields and regular Treasury yields, then, is equal to investors' collective bet on the rate of inflation. Right now, that spread is 2.3 percentage points on 10-year issues.

Investors should assume that rate for the next 10 years of annual inflation -- and house price gains.
Housing bears will point out that the recent year-over-year price gain is just 0.5%. All of it may be due to a recent drop in mortgage rates luring buyers, which isn't likely to repeat. And last year made for an easy price comparison, because prices dropped following the expiration of housing stimulus programs. Indeed, house prices may already be falling again. The latest Case-Shiller reading is for June, and really, it reflects purchases that were inked a few months prior.

Housing bulls counter that mortgage delinquencies are down, new home sales are up and affordability has been restored.

They each make good points -- and their views are already reflected in market prices for houses, which is why prospective buyers should ignore them. They should also ignore broker claims about a particular area being an up-and-coming one or a deep value. Those sentiments are priced in too.
Buyers should instead use their 2.3% house gain forecast in one of those renting-versus-buying calculators available. Good ones typically ask the user to plug in forecasts for their annual rent increases, annual house price increases and the rate of inflation. Use the same number for each (2.3% or whatever the current spread between TIPS and regular Treasury yields suggests).

Of course, house prices may not exactly track inflation over the next 10 years. They could rise more or less, and history suggests price gains will vary sharply by market. Even in the same market, some buyers will get better deals than others. But the point of the forecast is to base housing decisions on a sober look at likely outcomes rather than hope or hype.

Homeownership still looks like a good deal in most markets, but that has little to do with June's price rise or the possibility of timing the market.

Sunday, August 19, 2012

"Second Crash" Fears Recede Our Bank's Shadow Inventory


For years, some real estate analysts feared that banks would suddenly release a wave of foreclosed houses, swamping the local housing market and sending house prices into a second collapse.
That second tsunami isn't happening, according to an analysis by the North County Times.
A house-price crash precipitated a series of foreclosure spikes in 2007 and 2008, leaving banks holding thousands of houses and struggling to hire staff to process them.
After 2009, real estate agents and some analysts became convinced that lenders were holding off on foreclosures, and sitting on foreclosed properties in order to prop up prices, creating a "shadow inventory."
They feared lenders would have to process and release all those houses ---- sending house prices, which have been bouncing along a price bottom for two years, into another downward spiral.
Instead, the number of homes in default has been steadily declining in the region, thanks to a host of programs from government and private banks and a turn toward short sales, in which borrowers sell their properties for less than they owe.
And once lenders have foreclosed on properties, they have moved quickly to sell them, so the stock of properties held by banks is declining, according to an analysis of foreclosure data by the North County Times.
No conspiracy
"The idea that the banks are intentionally doing anything is itself ridiculous," said Chris Thornberg, a principal and an economist with Beacon Economics near Los Angeles. "There's not some Illuminati of banks. They're not holding back units, they're selling them as fast as they can."
Thornberg has long argued against a second wave of foreclosures, but other analysts worried about the shadow inventory.
Tim Ellis, an analyst at national real estate brokerage Redfin, has been among the most concerned, writing onRedfin's blog in February: "The fact remains that the banks are currently sitting on tens of thousands of homes across the country that they have foreclosed and not yet listed, along with tens of thousands more homes somewhere in between the first missed payment and the actual foreclosure.
"... Any sign, however slight, that prices may be on the rebound will cause banks to release more of their inventory onto the market, along with a wave of pent-up supply from would-be sellers on the margin to rush to list their homes to take advantage of the 'recovery.'"
Locally, the sentiment was similar.
Seeing shadows
"There's a lot of shadow inventory," Jeff Jenkel, a Rancho Bernardo real estate agent, said in May. "And so at some point it's going to get a lot worse before it gets better."
Even Douglas Duncan, chief economist for government lending giant Fannie Mae said in December, "The shadow inventory has to be worked through."
Do lenders hold properties off the market? Chase Bank responded to the North County Times' question, speaking only for themselves:
"No," said Lisa Shepherd, vice president of Chase REO and property preservation. "The only time that you would see a property that's not available for sale that goes through foreclosure is if it's in some sort of legal action that prohibits me from selling it."
Lenders sold off the majority of homes they foreclosed, according to a North County Times analysis of foreclosure data from ForeclosureRadar and transactions from the San Diego and Riverside county assessor's offices.
Fire sale
Between Jan. 1, 2007, and June 30 this year, lenders foreclosed on 16,570 houses in North San Diego County. By the end of that period, lenders held 780 houses ---- they'd sold off 95 percent of the houses they'd taken back.
The same trend holds for Southwest Riverside County over the same period: Lenders foreclosed on 36,037 houses, and by the end of June possessed 1,625, which is to say, they sold 95.5 percent of all the houses they'd foreclosed.
At a peak in fall of 2008, lenders held 1,315 houses in North County and 3,173 houses in Southwest Riverside.
If the lenders had the capacity to drop all those houses on the market right away, they probably could have affected prices: All those houses would have represented one-third of North County listings in the period, and half of Southwest County listings. Even this year, if lenders put all their houses on the market, it would change pricing.
But lenders can't flip a house instantly, said Shepherd from Chase.
"If the property is vacant and there are no issues, it should be anywhere from 30 to 45 days to get it on the market," she said. To sell the property, "on average, and especially in the state of California, anywhere from 60 to 90 days."
Inventory turns over
In 2007, lenders needed a median of 10 months to sell a house they'd just foreclosed on. By 2008, they needed a median of six months. At the end of 2011, they'd reduced that median to four months, in North San Diego and Southwest Riverside counties.
"What that means is rather than mismanaging things and holding things back, they (lenders) are reducing their inventory." said G.U. Krueger, a housing economist with Krueger Economics in Los Angeles.
Even as lenders have become more efficient at selling the houses they foreclose on, they're also foreclosing on fewer of them, largely thanks to government refinance and loan modification programs, private loan modification programs, and a new focus on short sales.
Those programs have helped lower the number of people in default. In San Diego County, as of June 30, there were 6,539 people in default on their loans but not yet foreclosed, down 35 percent from three years earlier, according to ForeclosureRadar. The number of people in default in Riverside County fell 34 percent over the same period to 8,821.
Those programs also have sharply reduced the number of foreclosures in the region: In July, lenders foreclosed on 223 houses in Southwest Riverside and on 126 houses in North County.
The result has been a steep decline in the number of houses available for prospective buyers ---- listings in both regions are down one-third from a year ago, according to the North San Diego County Association of Realtors and Redfin.
The tight inventory of homes for sale has led to bidding wars among buyers for the first time since the boom ended in 2006, and a stabilization of home prices in the region.
"People are starting to come out and buy homes," said Nathan Moeder, an economist and principal with London Group in San Diego. "There's going to be demand to suck up those homes."

Wednesday, August 8, 2012

Deliquent Mortgages Reported at 3 Year Low


U.S. homeowners are getting better about keeping up with mortgage payments, driving the percentage of borrowers who have fallen behind to a three-year low, according to a new report.


Still, the rate of decline remains slow, credit reporting agency TransUnion said Wednesday. The percentage of mortgages going unpaid is unlikely to return anytime soon to where it was before the housing market crashed.

Some 5.49 percent of the nation's mortgage holders were behind on their payments by 60 days or more in the April-to-June period, the agency said. That's the lowest level since the first quarter of 2009.

The second-quarter delinquency rate is down from 5.82 percent in the same period last year, and below the 5.78 percent rate for the first three months of 2012. The positive second-quarter trend coincided with an improving outlook for the U.S. housing market.

A measure of national home prices rose 2.2 percent from April to May, the second increase after seven months of flat or declining readings. Sales of new homes fell in June after reaching a two-year high in May. Sales of previously occupied homes also declined in June, but were higher than a year earlier.

Home refinancing surged in the second quarter, as interest rates sank to historic lows. And more borrowers with underwater mortgages -- or home loans that exceed the value of the home -- refinanced through the government's Home Affordable Refinance Program than ever before.

"More people are making their payments, and that's great," said Tim Martin, group vice president of U.S. housing for TransUnion. "I expected a little bit better, but maybe we'll see some more of that pick up in [the third quarter]."

Even as housing trends turned positive earlier this year, the U.S. economy began to show signs of faltering. The national unemployment rate remained stuck at 8.2 percent, and the pace of job growth slowed sharply, with employers adding an average of only 75,000 jobs in the April-June quarter. Hiring appeared to pick up in July, however, with employers adding 163,000 jobs.

TransUnion anticipates the mortgage delinquency rate will continue to decline. But it doesn't see it falling below 5 percent this year.

The national delinquency rate remains well above its historical range, an indication many homeowners are still struggling five years after the housing downturn.

Before the housing bust, mortgage delinquencies were running at less than 2 percent nationally. It took about three years after the housing market crashed for the delinquency rate on mortgages to climb to a peak of nearly 7 percent in the fourth quarter of 2009. The rate has been trending down since then. Home prices need to recover further for the delinquency rate to decline.

At the state level, Florida led the nation with the highest mortgage delinquency rate of any state at 13.48 percent, down from 13.91 percent a year earlier. It was followed by Nevada at 10.85 percent; New Jersey at 8.15 percent; and, Maryland at 6.79 percent.

The states with the lowest delinquency rate were North Dakota at 1.32 percent; South Dakota at 1.94 percent; Nebraska at 2.24 percent; and, Wyoming at 2.41 percent.

Foreclosure hotbeds Arizona and California each saw marked improvement during the second quarter.
California's mortgage delinquency rate fell nearly 22 percent to 6.13 percent from a year earlier, while Arizona's declined 21 percent to 6.14.

One reason for the sharp declines in mortgage delinquency rates in those states is that homes tend to move faster through the foreclosure process than in Florida, New York and other states where the courts play a role in the process. That leads to logjams of cases involving home loans that may have gone unpaid for two years or more.

"You have states that are taking a long time to work through the delinquencies that they have, which is keeping their numbers up," Martin said.


Monday, August 6, 2012

Beautifully Renovated and Affordable Home for Sale

    Soquel Condo For Sale
                $299,000

* 3 Bedrooms, 1.5 Bathrooms
* 1083 Square Feet
* Private Garage
* Landscaped Front and Back Patio

                 Features
* New Granite Counter Tops
* New Kitchen Appliances
* New Carpet Throughout
* New Fixtures Throughout Home
* New Vanities in Bathrooms
* New Tile Floors in Bathrooms
* New Doors and Hardware

Centrally Located. Walking distance from Cabrillo College. Short drive to schools, shopping, churches and beach. Turn key home in move in condition!


Call Greg for more information!
(831) 426-0294 Office
(831) 454-6846 Cell